Hi Guys
Inside my EA I’m trying to create a button to export a personal graphic of equity curve, or histogram of operation, or any kind of graphic. But I’m didn’t find a way to export to JPG or BMP. In realy I’m trying to do a personal report.
I already looked inside some classes, examples and files like “Graphic.mqh”, “Axis.mqh” and “Curve.mqh” but there is no “Save” or “Export” method.
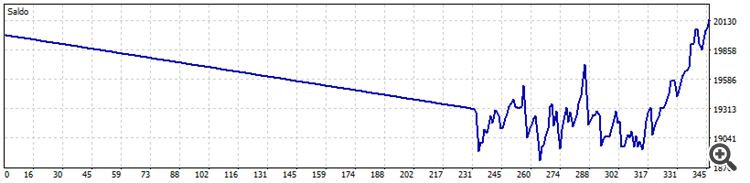
I spect to create a graphic, not necessary to be a visual object, add some X, Y points, and finally save in a ordinary image file. If is possible to customize some collors, good, if not, also good (one step at once). As a first goal I expect to creat an image like the standard backtest equity curve:
If anybody have a clue on how to do it, I really appreciate,
Thanks in advance