How Granular is the Past Data in MQL5?

When conducting back-testing in Metatrader 5 you can select “tick by tick” level data. My question is, does this option really allow you test a strategy against real tick-by-tick data? Does MQL5 really and truly record every tick of trading that took place for the financial securities where this option can be selected in the Strategy Tester Screen?

What I am looking to do is see what is happening during the first minute after key announcements, such as rate decisions by central banks. If, for example you sold prior to the announcement, and the price shoots up, it makes a big difference whether you are able to close the sell position during the 1st tick of actual trading that takes place vs the 2nd or 3rd -because the price movement is volatile and the difference between these may be significant. Is it possible to conduct this sort of analysis on MT5 with accuracy, and if so, how far back can one go with this granularity of analysis?

Thank you

Yes, you can run backtests with real ticks data (that is “Every tick based on real ticks”, which is different to artificial “Every tick”).

But no, you can’t emulate how your broker would process your trading orders in reality. All you get is ticks. Also you can simulate random delays in execution (which is very probable at high volatility market), but this will be different to what could have happened online.

This is truly fascinating and in fact, hard to believe. How many damn terabytes would that immense amount of data make; must be just gigantic amounts of data and storage space. I guess this data comes from the trading information that flows through the Metatrader Terminals and is captured anonymously on an aggregate level? (the description below states “It uses real ticks of financial instruments accumulated by a broker.” so i was wondering if accessing this data will allow me to see just the data captured through one broker -the one that I am using- or data captured through various brokers)

By making the appropriate selections in the STRATEGY TESTER. it is easy to run the back testing of the algorithms based on every tick or true ticks. But what if I wanted to sit down and just visually inspect the data, as in I wanted to see “where prices jumped to, where trades happened and so on, so forth” where can I do so?

Finally, the distinction between these two is not fully clear.

  • Every tick is the most accurate but also the slowest mode. It emulates all ticks.
  • Every tick based on real ticks is as close to real conditions as possible. It uses real ticks of financial instruments accumulated by a broker. Emulation is not performed. Tick data has larger size. Downloading it may take quite a long time during the first test.

OK, so every tick is what it suggests and is created by capturing every trade and where these trades have happened. Right?
But how is the the “Every tick based on real ticks” different?

And finally, I put it rather poorly in my earlier question in that such data can of course not tell me where a particular order I would have provided would have been filled. That is impossible to speculate on, as you said.

This is tremendously helpful; thank you so much…

Real ticks are not recorded automatically by MT5 Terminal (except a limited number, the X most recent, I don’t remember how much).

Real ticks are downloaded on request only, by the Strategy Tester. For example, on Metaquotes-Demo server 1 year of EURUSD ticks data needs approximately 176 MB.

The difference is “Every tick” used emulated ticks, these ticks are calculated from M1 history data. You can execute the Strategy Tester, in visual mode, and that tick by tick if you want.

What Stanislav explained above is while the Strategy Tester will be using real history ticks, the trade orders sent and processed will only be “virtual”, not exactly like a real market (except the option “random delays” which is a little more realistic).

Thanks a lot @kgasking1c ,

Can I simply sit back and watch the ticks in slow motion or download them (for only a single one-minute period) into something like an Excel spreadsheet or csv file?
Even on the slowest setting of STRATEGY TESTER, the visual is too fast to make sense of the tick-by-tick movements.

I would suggest you to try and stop asking question you could answer yourself easily.

Pause the tester, look them with a microscope if you want, save them to csv…something useful too is the documentation (F1).

Please excuse this one follow up:
I have gone through all the help menus and went through all the possibilities. However I am not sure still what you mean when you say to save them to CSV. I could not find a way to download a price history or to save such history by copy pasting. Is there a way?

Thanks very much in advance

  1. You don’t download price history manually. It does it automatically when you start a back-test where you have selected Every tick based on real ticks"* .
  2. You can output in CSV or any other format, from within your own EA (customised MQL Code), by reading the tick data and outputting it to whatever file format you wish to implement, be it CSV or some binary format. You could even output HST and FXT files for MetaTrader 4 if you wanted to.

Thanks so much

Do I need a EA for this? I am not a programmer, but a regular user of MT4 and MT5.

Is this something I can manually do or would someone need to write a code for this?

Again, I really appreciate the input here.

Do I need a EA for this? I am not a programmer, but a regular user of MT4 and MT5. Is this something I can manually do or would someone need to write a code for this?

  1. Your original question about back-testing with real tick data has been answered with a positive, where by selecting “Every tick based on real ticks” , the application will download all the necessary tick information automatically. On the first run, it might take some time to download all of that data, but subsequent passes will run normally.
  2. You don’t need to produce CSV data if you are just doing normal back-tests. As stated, it already downloads all the necessary tick data automatically.
  3. If however, you need the tick data in CSV format for other purposes, then yes, you will need to code it according to your needs. But, you only started to mention it after @kgasking1c pointed out that possibility. So the question is, why do you want to produce CSV tick data? (also see below, on using the Visual mode ).

But what if I wanted to sit down and just visually inspect the data, as in I wanted to see “where prices jumped to, where trades happened and so on, so forth” where can I do so? …

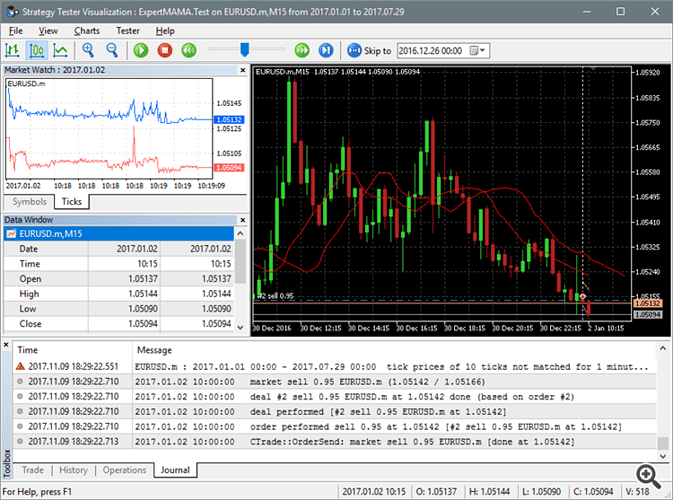
Just run the back-test in Visual mode and you will see everything play out. You can even speed it up or slow it down or pause, or jump to a particular date.

How many damn terabytes would that immense amount of data make; must be just gigantic amounts of data and storage space …

Actually, unlike the file formats used in MetaTrader 4 , in MetaTrader 5 it does not take up much space, because it is stored in a packed non-duplicating format.

Finally, the distinction between these two is not fully clear.* Every tick is the most accurate but also the slowest mode. It emulates all ticks.* Every tick based on real ticks is as close to real conditions as possible. It uses real ticks of financial instruments accumulated by a broker. Emulation is not performed. Tick data has larger size. Downloading it may take quite a long time during the first test.
Every Tick" is simulated tick data generated based on Bar data (similar to what is done in MT4). It is not based on Trades (as you put it), because that has nothing to do with it.

“Every tick based on real ticks” is Real tick data, not Simulated data. The above documentation, is actually quite clear on this!

Of course I started to mention it after @kgasking1c pointed out that possibility, because before then I did not realize it was possible. How can I ask about the details of a procedure before realizing this was a possibility?

Why I want to produce CSV (or word or any other similar format) tick data?
Because I want to study how prices move on the micro scale over a specific and very short period of time… kind of obvious, no?

Finally, my question in real vs simulated was already answered. Thanks a lot for answering this and pointing out that the documentation is clear, but I already realized this after reviewing the material and did not ask this in any of the recent questions. thanks anyway

I suspected it but no, it is not obvious, hence why I asked!

You can easily get hundreds of ticks per minute and it is much more common to analyse such data “visually”, such as the Ticks chart in Visual Mode of the back-testing, hence why I placed the text “(also see below, on using the Visual mode ).”

In the Visual Mode, with the Ticks chart open, you can easily control the speed very well, so I don’t understand your statement “Even on the slowest setting … the visual is too fast to make sense of the tick-by-tick movements.”

Also, producing CSV files of tick data produces gigantic files, which DO NOT facilitate analysing the “microscale” at all. The application already offers much better tools to analyse the “microscale”, and there is no need to produce CSV for the reason stated.

Hi, I wanted to know that difference between “every tick” and “every tick based on real tick” in mt5.
I have developed EA in mql5 and my EA working very well on demo account but not good on real account yet. When I backtest on every tick mode it is working very well like demo but on real tick it is loosing. So my question is “every tick based on real” is like real account or real market condition (not about real or demo)? Because my ea works very well on demo but loosing on backtest when I use “every tick based on real tick”. If the real tick mode is similar with real market condition then why my ea is working on demo so well?