Help my indicator "onchartevent"

Hello, how are you? currently my indicator it does the following

I drag an object to a candle and plots a vwap

I’m trying to change this to

1 ° Click on the object
2 ° Click on the candle = [Vwap was inserted]
3 ° Click object again = [Vwap removed]

But I can not build this structure, can anyone help me?

Code:

void OnChartEvent(const int id, const long &lparam, const double &dparam, const string &sparam)
  {
 int x,y,i;
 datetime tm;
  double pr;
  int subW=0;
 
   if(id==CHARTEVENT_OBJECT_DRAG)
     {
         for( i=0; i<4; i++)
         {
             if( sparam==ObjNames[i] ) 
             {
              IsMoveStarted[i]=true;
             x=(int)ObjectGetInteger(ChartID(),sparam,OBJPROP_XDISTANCE);
              y=(int)ObjectGetInteger(ChartID(),sparam,OBJPROP_YDISTANCE);
            ChartXYToTimePrice(ChartID(),x,y,subW,tm,pr);
             BoxTimes[i]=tm;
             BoxPrices[i]=pr; 
             
             
    {
    
    }

Hi Matheus.

Just trying to make sure i understood your question right :blush:. You are trying to remove a object from the chart after these exact sequence of actions?
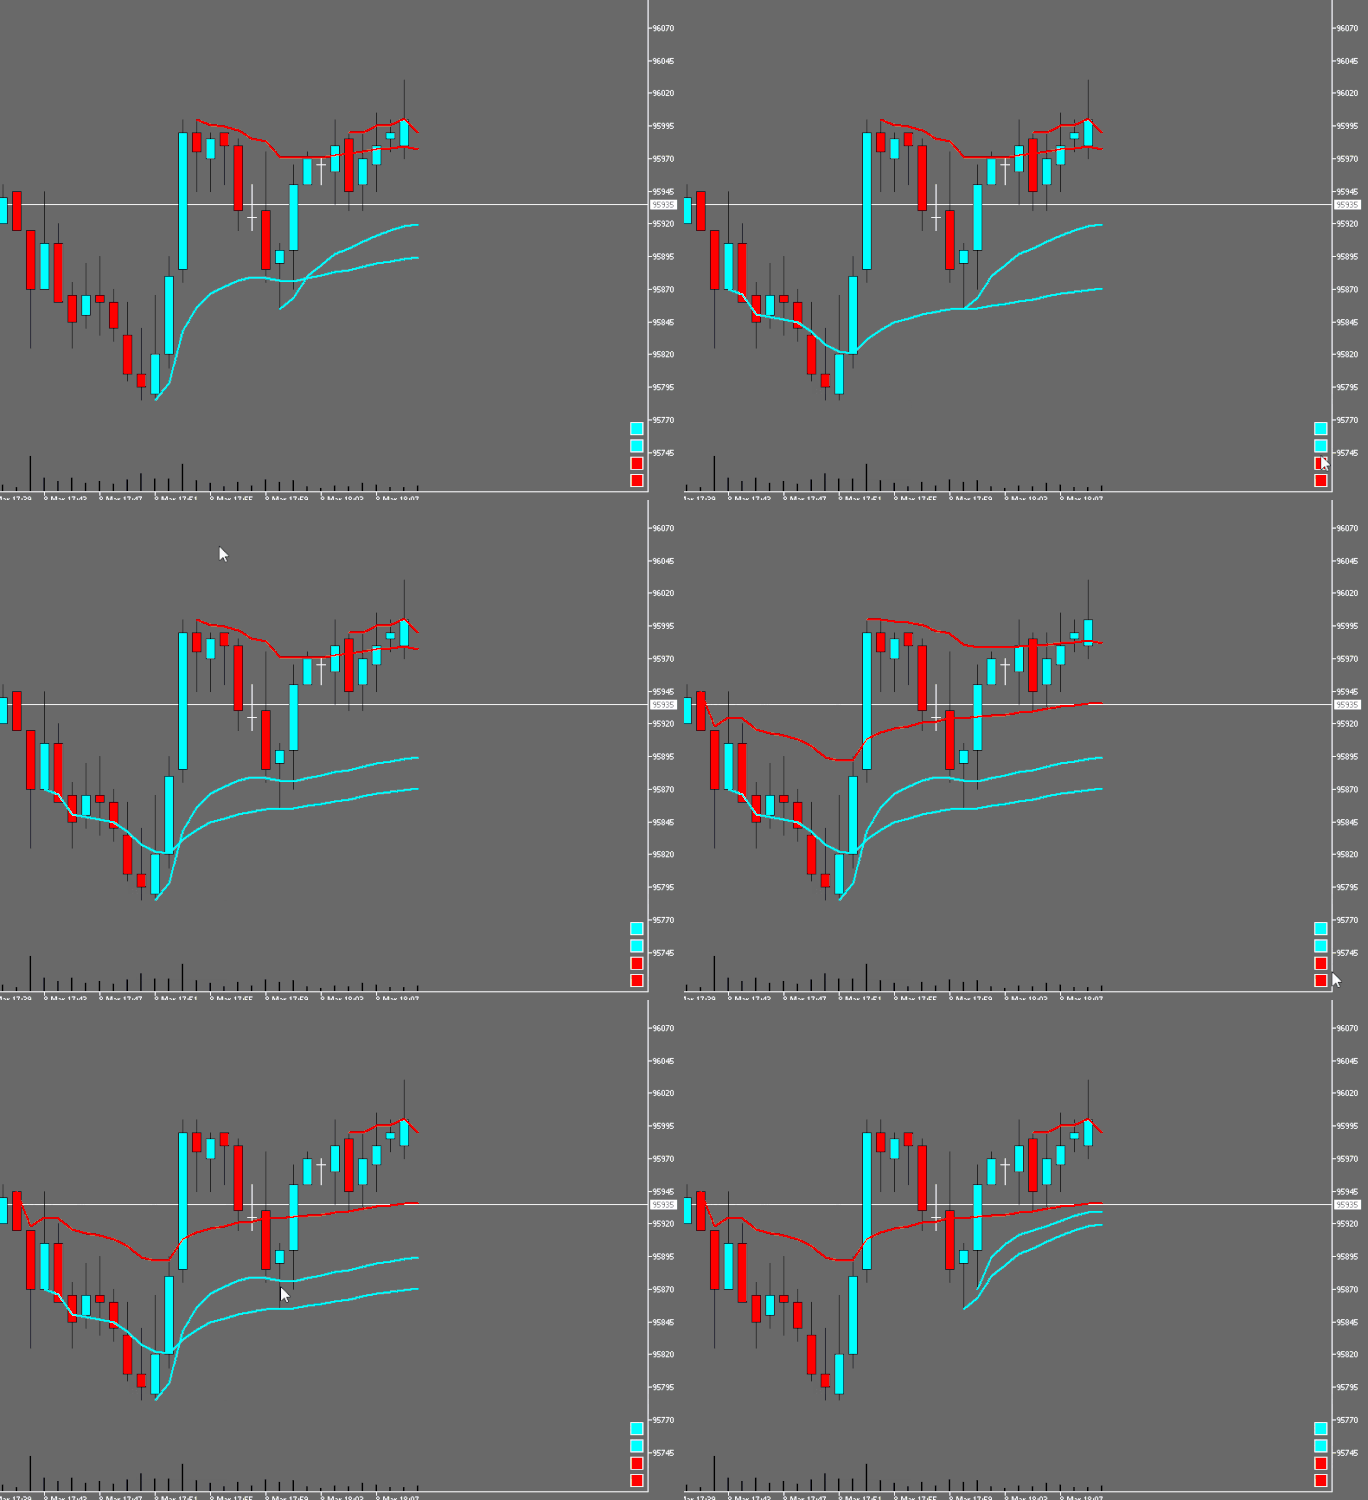
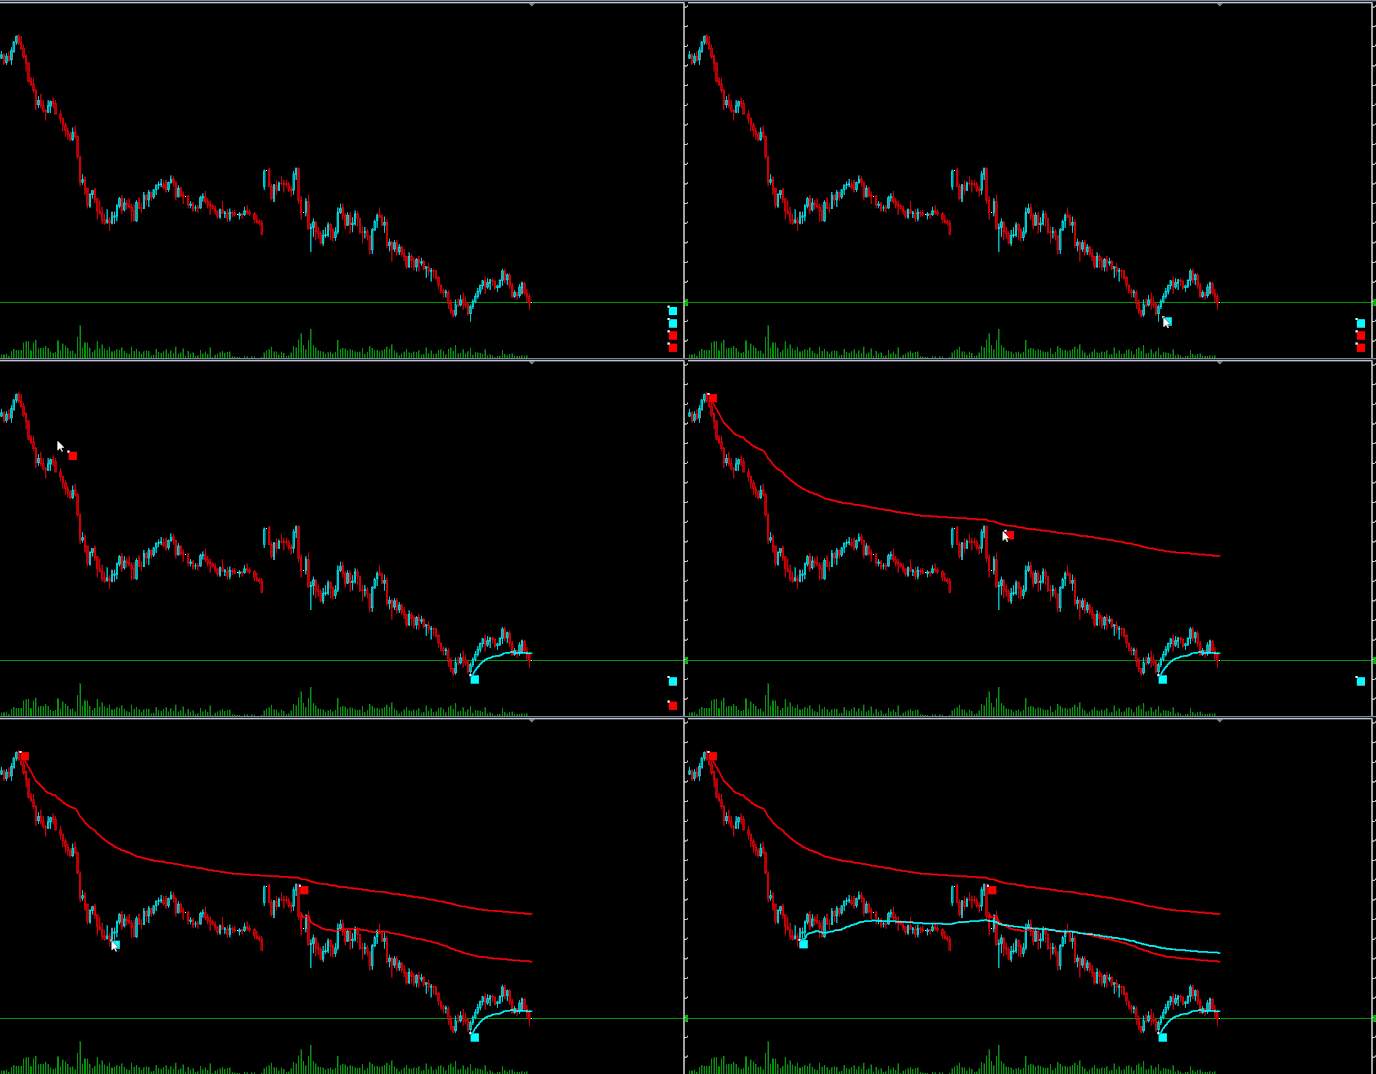
  1. click on the object
  2. click on the candle
  3. click on object again and expect it to be removed

Please let me know if the clarification is correct.

Yes,
1st click on object
2nd click on the candle [line is plotted after I click on the candle]
3rd click on object again [line is removed from where I plotted]

same as shown in gif

Thanks for clarifying using the gif. You already know which object is selected (using lparam) so the next thing you need to do is to delete it. To delete an object you use ObjectDelete and here is its signature:

bool  ObjectDelete( 
   long    chart_id,     // chart identifier 
   string  name          // object name 
 );

Parameters:

chart_id [integer]: Chart identifier. 0 means the current chart.
name[integer]: Name of object to be deleted.

Sorry, I think I did not explain well, I’m trying to leave the same as the gif I showed, currently mine does it

Hmm… sorry @Matheus_Mathias I still can’t quite understand your point

I’ll explain it better, my indicator drags the box “CHARTEVENT_OBJECT_DRAG”

I want him to do the same as the 1st gif

1 ° Click on the box
2 ° Click on the candle = planned line
3 ° Click the box again = Row removed

I want to know the structure that you have to set up to do the 1st, 2nd, 3rd.
I want the second gif indicator to be the same as the first gif indicator